Calibration standards for LIBS
Laser Induced Breakdown Spectroscopy
LIBS (Laser Induced Breakdown Spectroscopy) uses a laser beam to interact with the sample. Due to the extreme heat of the laser (10,000 K and more) a plasma is formed. A plasma is a cloud of ions (charged atoms) and electrons (negatively charged particles). When this plasma collapses it emits light. Light is a mixture of different wavelengths.
This light is then transferred through a fiberoptic cable to a spectrometer, which can precisely split the light into its respective wavelengths. The working principle of the LIBS-spectrometer is similar to a prism as it disperses the incomming light. Each element has several characteristic wavelengths. A detector is able to attribute an intensity to each of them.
This way you can already find out which elements are contained in the sample. If you want to know how high the concentration of an element is, you need a reference material with a known concentration.
Our pressed pellets as well as the Nano-Pellets despite being binder-free are able to withstand the impact of the laser shots and are therefore suitable as reference materials for LIBS.
LIBS spectrum of basalt

The left figure shows 10 measurements for lithium on a Nano-Pellet made from OREAS 147. The right figure shows 10 measurements on a pressed pellet made from original OREAS 147 powder. It is interesting to note that the signal intensity is lower in the Nano-Pellets compared to the original pressed pellets. Most likely this is due to the shiny polished luster of the Nano-Pellets, which reflects some of the incoming IR-laser light. While the signal is higher in the pressed pellets it is also more scattered. This shows a need for sampling and averaging a larger surface area on the sample to obtain an accurate average spectrum.
LIBS spectrum of basalt

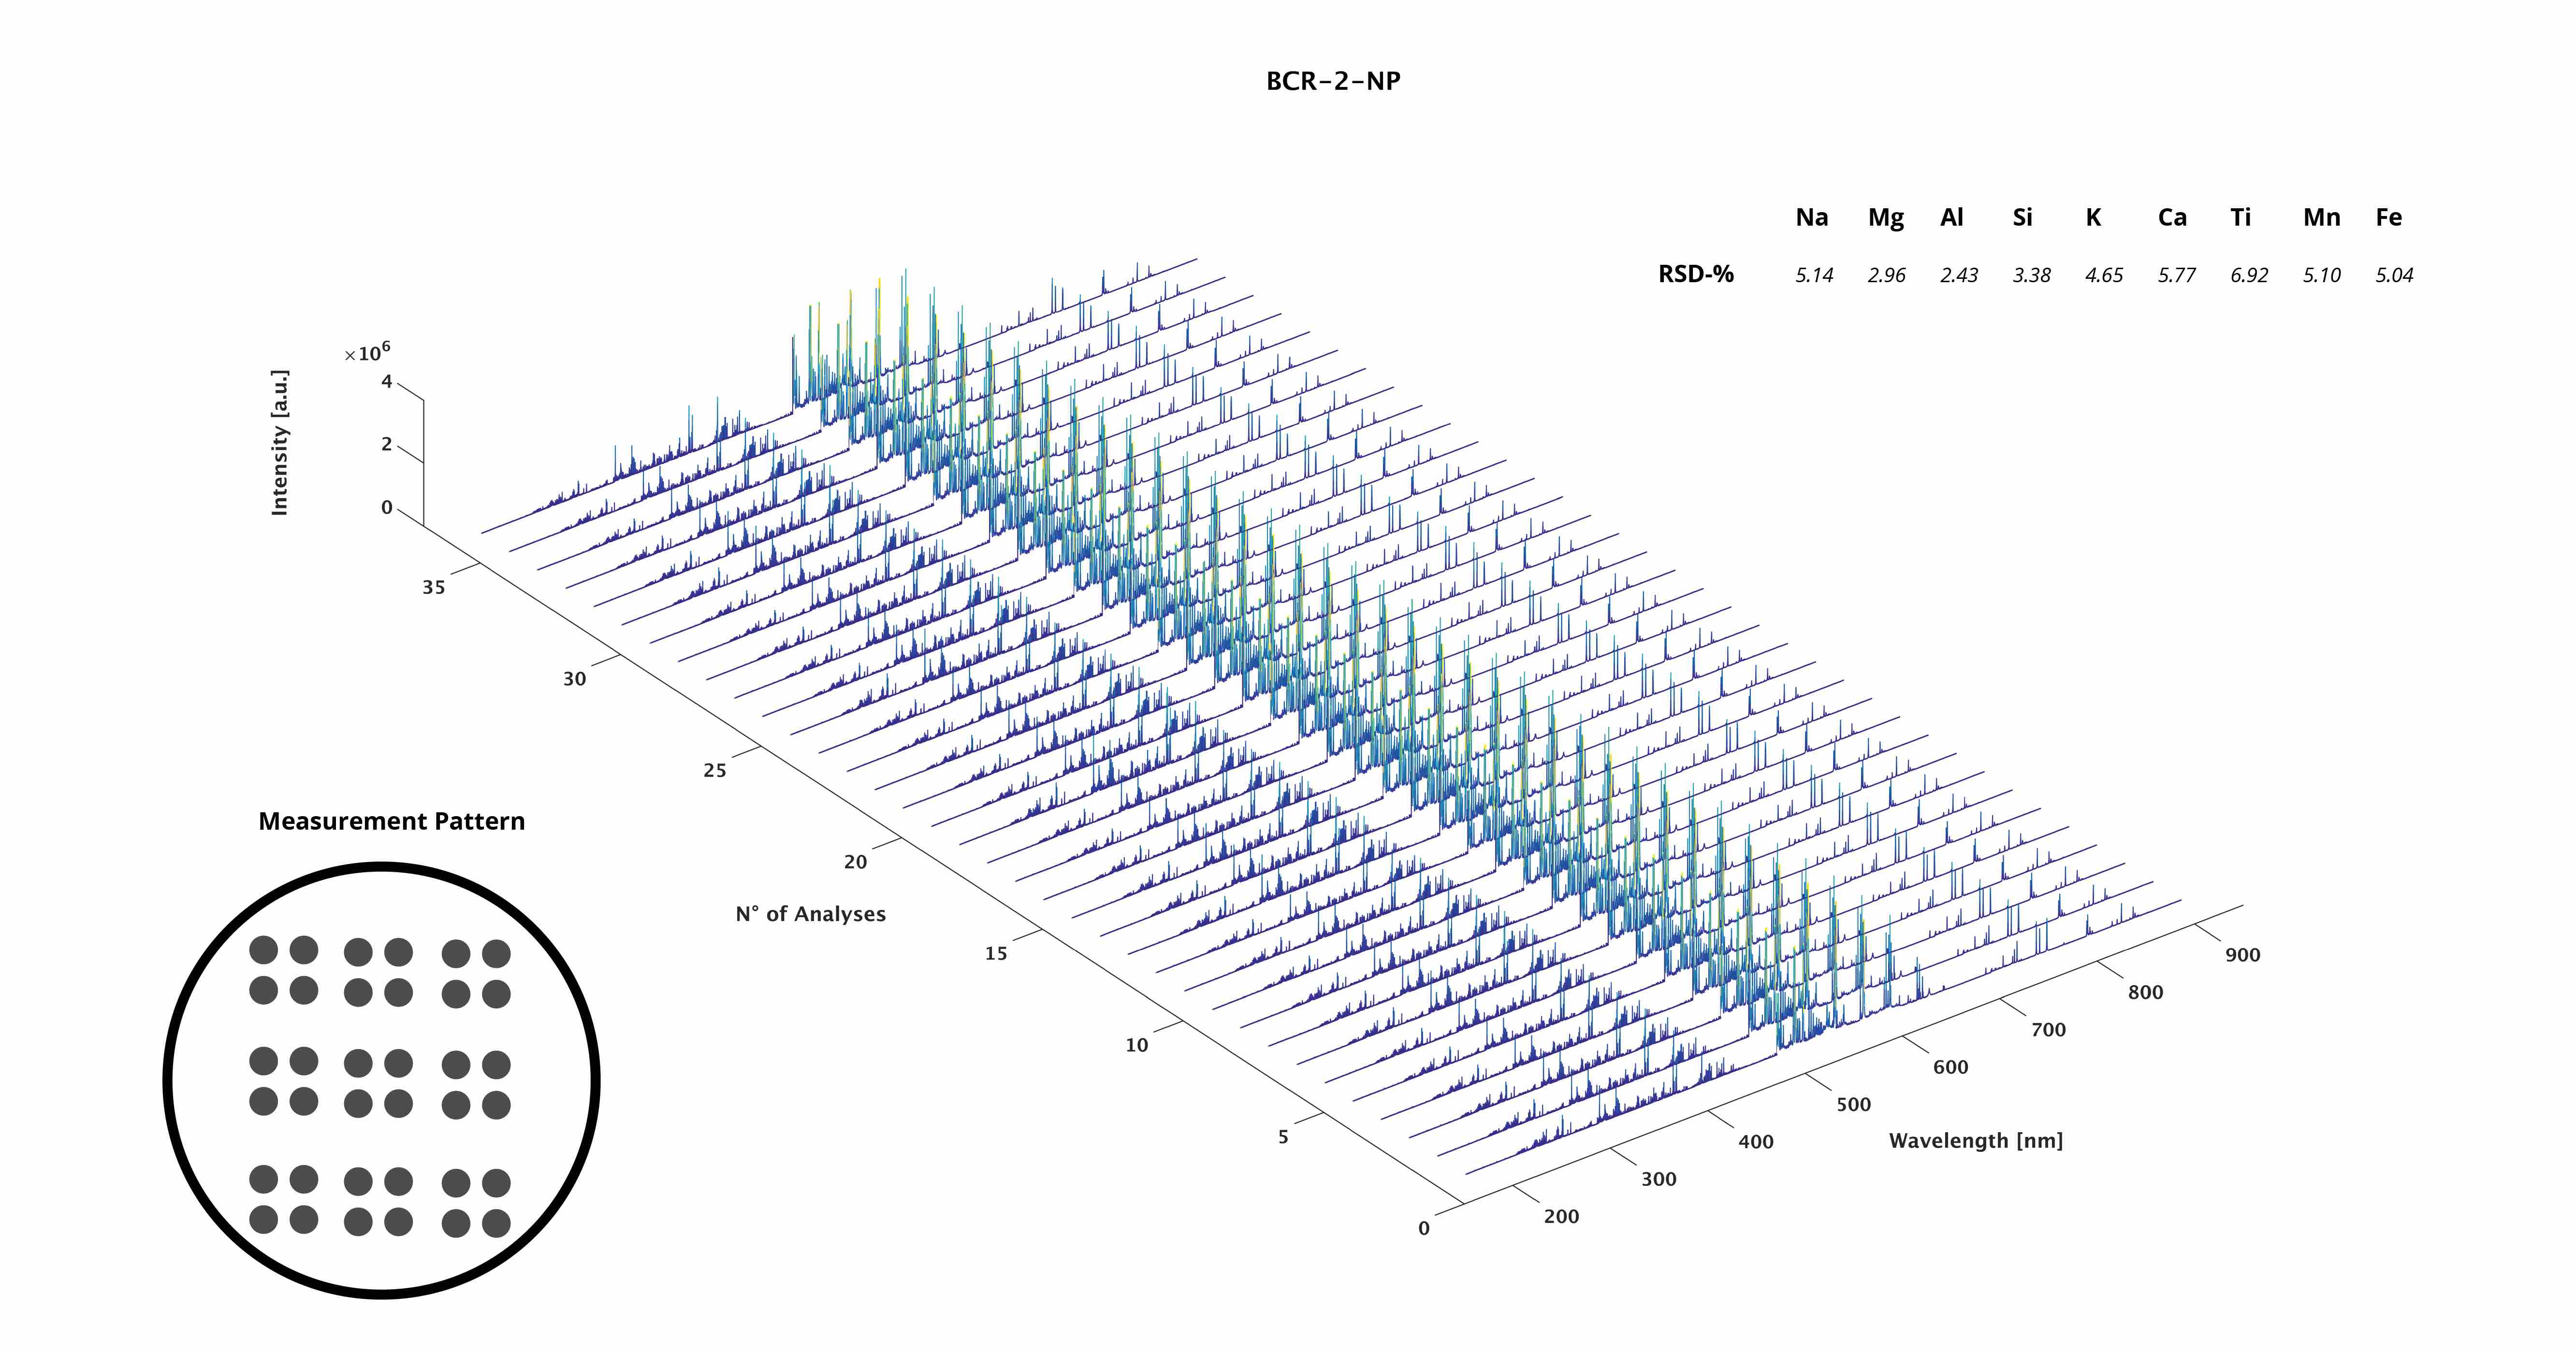
LIBS spectrum of BCR-2-NP

Waterfall plot - basalt rock
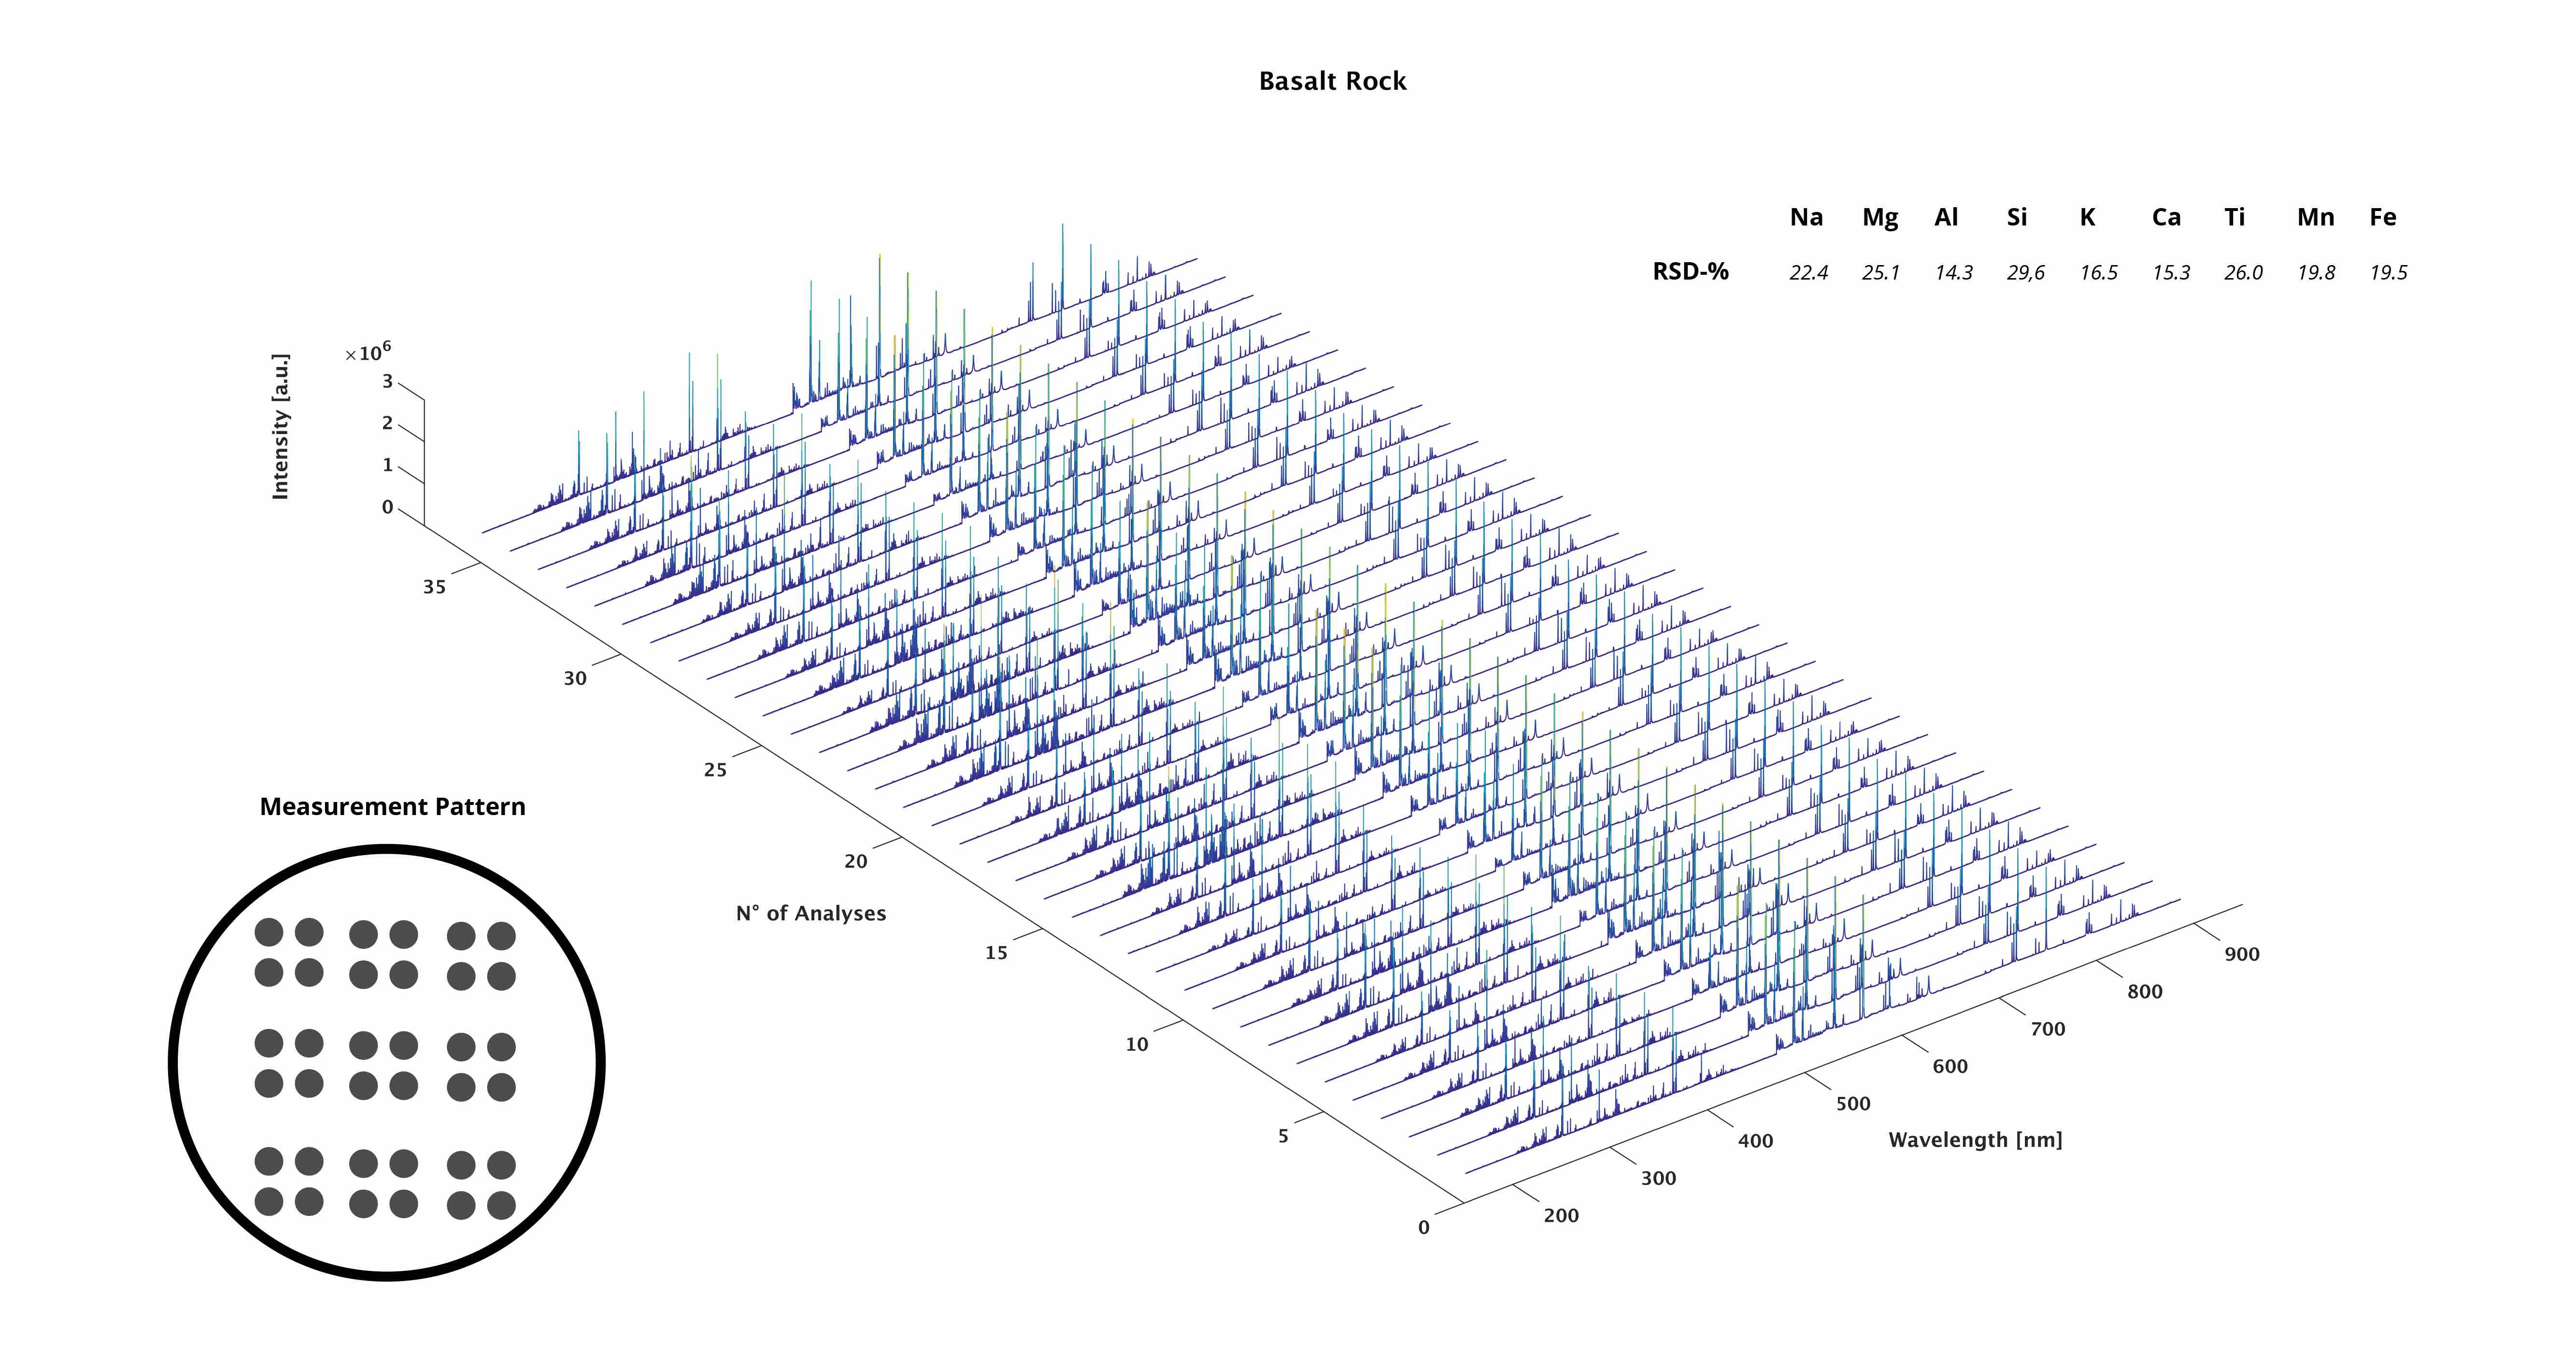
Waterfall plot of BCR-2-NP
